Getting More From Yardi and Your Property Management Software
Originally published on June 5, 2026
“Static reports tell you what happened. Dashboards tell you what you need to do right now.” — Daniel Roccanti
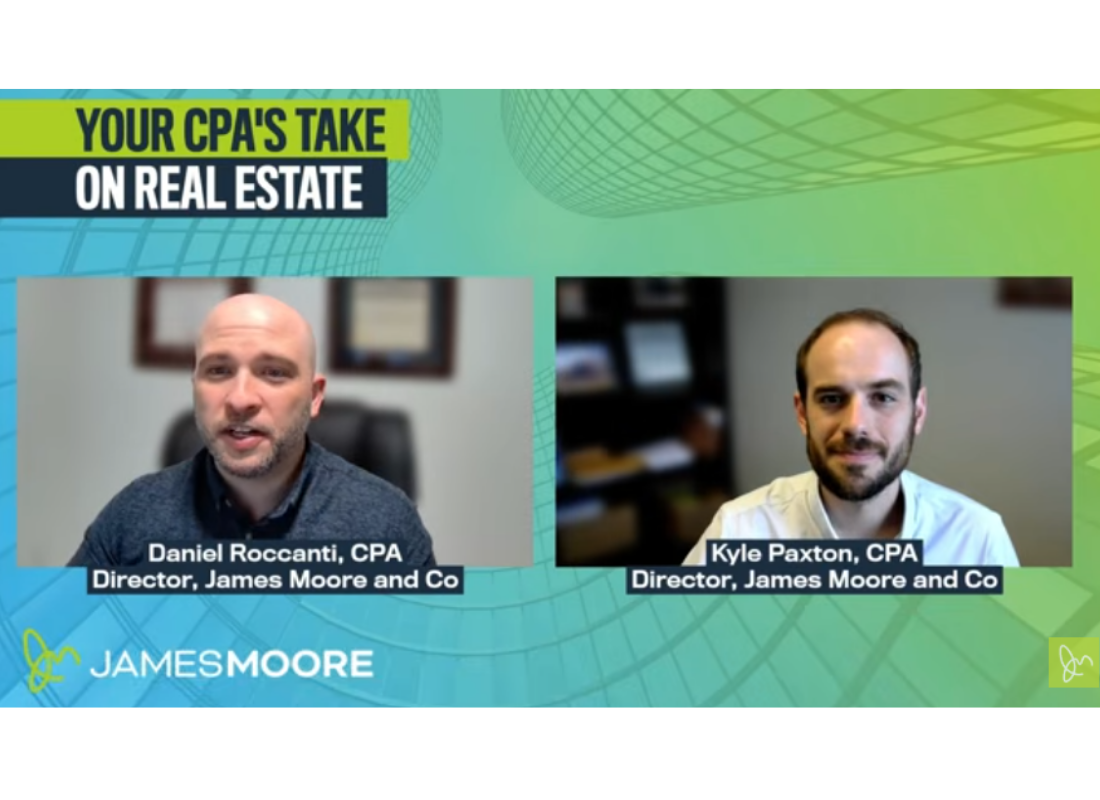
In this episode of Your CPA’s Take on Real Estate, Daniel Roccanti and Kyle Paxton break down how real estate firms can get more value from Yardi and similar property management platforms. The conversation covers why real-time dashboards vs. static reports is not a choice between the two, the KPIs that matter most at the operating, fund and debt level, and the configuration mistakes that silently corrupt reporting across the portfolio.
Most firms are sitting on an enormous amount of data inside their property management software. This episode is about making sure that data is actually working for your business.
Resources
- Real Estate Industry Services | James Moore
- Your CPA’s Take on Real Estate | YouTube Playlist
- Watch the Full Episode
Full Transcript
[00:03] Daniel Roccanti: Welcome to Your CPA’s Take on Real Estate. I’m your host Daniel Roccanti here again with Kyle Paxton on another video. Today we’re going to talk about getting more from Yardi or whatever property management software you’re using. Most real estate firms have an enormous amount of data sitting in Yardi or their property management software.
[00:25] Daniel Roccanti: Is it really helping them to the full maximum potential or is it just helping their accounting team close the books? This tremendous amount of data sitting in your property management software like Yardi should be helping you make better decisions for your activity and for your firm.
[00:44] Kyle Paxton: Yeah, Daniel. We throw around Yardi a lot. We really like it as a software platform. In just about every video you and I record, I’m talking about getting access to that real-time data. It’s really easy for me to throw in that buzz line, that quick one-liner: we’ve got to get real-time data. But what does that actually mean? In the accounting world, in the AI era, we’re implementing new software it feels like every day to better our practice and what we offer. But purchasing isn’t actually implementing. What we need to do is be very intentional about how we amass an immense amount of data in real time.
[01:24] Kyle Paxton: How do I create the proper processes both within the software and within my team to actually optimize the software and make it useful, so you’re not just bombarded with data? We like Yardi as the flagship property management accounting platform. There are so many shapes and sizes Yardi can fit, and many different businesses can really implement Yardi effectively.
[01:45] Kyle Paxton: In this age, we have to be able to use the mass amount of data that we can get in real time and distill it down into ways that we can actually use it and make real-time business decisions.
[02:08] Daniel Roccanti: Yeah, Yardi is often underutilized because it’s mainly used as an accounting software. And it’s an amazing accounting software, but it’s so much more than that. It’s not just about making sure I have good reports and good ledgers. You really want to get into what is that next level you can bring to your business. And it really starts getting into real-time dashboards versus static reports.
[02:32] Daniel Roccanti: Static reports still matter. Kyle and I are CPAs. We love our financial statements and our trial balances, and these are needed. But you need more than just that if you really want to run a high-functioning business. Static reports come out and need to be reviewed. Real-time dashboards give you that data instantly to help you make better decisions.
[03:02] Kyle Paxton: Daniel, I see this come up a lot when we’re talking about static reporting in the real estate space. A lot of times this comes to the surface in the lending space. You’re trying to refinance, close on a loan, whatever it is, and the bank is looking for reports and an understanding of your financial situation.
[03:20] Kyle Paxton: A lot of times we are helping our clients pick up scraps from two years ago to get some static reports to give an indication of how the business is doing. We can do better than that now. Both in that compliance space and as a business owner making decisions, we can really capture that movement in more real time.
[03:43] Daniel Roccanti: We’re talking about Yardi a lot because we really see that Yardi is one of the software platforms that really moves the dial in this space. We use QuickBooks with a lot of our clients, but once you get into the real estate space, you have a wide range of properties you’re managing. Different types of reporting, you have rentals, flips, wholesale activity, multifamily properties, several single-family rentals.
[04:02] Daniel Roccanti: As all of these inputs grow, your accounting records and real-time data gets more complicated. You really need a robust data source and software that can distill all of this down and give you an understanding of how your business is doing.
[04:33] Daniel Roccanti: Your business needs static reports and it needs something more timely. Real-time dashboards are usually the answer. Static reports are always telling us what happened, giving us historical data, and they take time to finalize. Dashboards are a lot quicker. They’re about what is changing and what do we need to do now to act.
[04:57] Daniel Roccanti: Whether you’re management or an investor, you need both. We do a really good job with static reports, not as much when it comes to real-time data. So let’s get into it. If we’re going to start building dashboards or use Yardi’s built-in dashboards, what are some custom KPIs that fund managers should really be tracking?
[05:19] Daniel Roccanti: The first category is operating performance. There are tons of KPIs Kyle and I know, and you really need to identify which ones are best for you and your business. If you’re looking at a million KPIs, you’re really not actually looking at any KPIs. It’s data overload. So you need to figure out which operating performance KPIs are most important to you.
[05:42] Daniel Roccanti: For most real estate firms, I care a lot about occupancy. Most landlords do. When I’m looking at operating performance, I want to know my occupancy. I want to know both physical occupancy and economic occupancy.
[06:38] Daniel Roccanti: This is different. Physical occupancy is what units or space is actually being occupied. Economic occupancy is more about potential. What percentage of potential rent is actually being earned? So I factor in vacancies, concessions and discounts. We always forget that it’s great that it’s occupied, but maybe I had to offer a lot of concessions and discounts to get it occupied.
[07:04] Daniel Roccanti: So I’m actually potentially missing out on rent because I’m not renting it to its full potential. That’s where economic occupancy really matters, because oftentimes it’s actually more important than physical occupancy. Maybe when I look at my physical occupancy I’m doing great, it’s 95% occupied, which is pretty high in the real estate space. But then I’m looking and over 50% of these I’ve had to do some kind of discounts or concessions.
[07:32] Daniel Roccanti: Yeah, it’s fully occupied and that is great, but it doesn’t tell me the full story.
[07:38] Kyle Paxton: There’s a huge list and this is sliced in a lot of different ways depending on what you need. Thinking through delinquency trends, bad debt, leasing velocity, renewal rates, rent trade-outs, concessions. All of those things come into operating performance.
[08:10] Kyle Paxton: One thing I want to make sure we’re talking about with these dashboards is really slicing these metrics at both the macro level and the micro level in a way that makes sense. Drawing the connection to what we do internally at James Moore, we swap out real estate for people to some degree. In a given five minutes I can get a good pulse on firm performance in certain areas we track closely and then distill it down to individuals and how those individuals are performing. That helps me as a coach and helps further the business at the macro level, then distilling that down to individual people or properties.
[09:16] Daniel Roccanti: Yeah, and the whole point of KPIs is getting data instantly. It doesn’t always have to be the most accurate, but it gives me a signal. If my occupancy starts dropping and I’m waiting on historical data to get to me, I don’t have time to make decisions.
[09:38] Daniel Roccanti: Operating KPIs I care about include occupancy, but I also want to see rent collection. Maybe my occupancy is high but I’m starting to not actually be able to collect. Am I really collecting? And then I usually want to see my net operating income versus budget. This is a really important one. What I budgeted, how does it start differing? You’re never going to be exactly on budget, but what are the big swings? This can usually show whether your properties are performing under or above expectation.
[10:00] Daniel Roccanti: And then if you have multiple levels of properties, I really want to look at same-store growth, because you can look at things at the fund level and miss an underperforming property. Those are the main ones when I’m thinking about operating. But there’s so much more like Kyle mentioned. Delinquency trends, leasing velocity, renewal rates, concessions and discounts.
[10:49] Daniel Roccanti: Start going into another category here, which is fund and portfolio performance. We were talking at the operating level, but now at the performance level it feels more high-level, that topline macro.
[11:10] Daniel Roccanti: What is my fund-level IRR? I need to know how well my properties are doing at the property level, but now how well is my fund doing overall? You could have one property doing really well and one doing really badly, and at the fund level they kind of equal each other out. This is usually what my investors are going to be looking at.
[11:56] Kyle Paxton: Daniel, what I see happen in this fund space is that investors entering a fund are kind of sold on those underlying properties individually. If I’m contributing $100,000, the GP is saying $20,000 is going to this property, $30,000 is going to this property, and being pretty clear on how that’s divided amongst the fund’s actual investment portfolio.
[12:30] Kyle Paxton: What I see happen sometimes is investors get stuck on the individual properties. And sometimes I find that the operators or general partners really struggle to communicate how the individual property performance feeds into the overall fund performance, both from the economic side and then just the tax reporting side and how those things overlap. So much of that comes from looking at static data from a year and a half ago. Being able to distill these metrics and KPIs in a way that we can quickly understand how the individual and the higher level blend together is super important.
[13:33] Daniel Roccanti: Going back to the KPIs here, there are equity multiples. Investors really want to know how much they’re getting back. It’s basically a multiple of what they’ve received based on what they’ve actually invested in capital. There are also distributions to date and net asset value movement. These are all important ones. You just need to make sure you understand which ones are important to your business.
[13:51] Daniel Roccanti: Moving to the debt and liquidity risk category. This is always going to be important in real estate. One of the nice things about real estate is leverage, but you have to fully understand what leverage is because it’s a double-edged sword. It can absolutely multiply your rate of return and it can destroy it at the same time. So you always want to make sure you understand where your debt is.
[14:37] Daniel Roccanti: Very common KPIs when we’re talking about debt: your debt service coverage ratio is probably one of the most important. We need to make sure we can cover our debt. Are we generating enough income to cover our debt? If that starts decreasing over time, you want to know as quickly as possible so you can take action.
[14:59] Daniel Roccanti: Debt yield is very important to lenders. A higher debt yield usually means lower credit risk. And loan to value indicates your leverage. A higher loan to value means more debt relative to value, which could increase refinancing risk and reduce flexibility. Those are the main three when I think about debt.
[15:46] Daniel Roccanti: But there are other important KPIs. Near-term refinancing risk: if you’re getting close to having to refinance, what does the market look like? Are interest rates increasing? Floating rate exposure is another great one. If I have a lot of interest in debt that moves with a benchmark and benchmarks are moving up, my interest rates are moving up, which affects everything including my debt service coverage ratio.
[16:16] Daniel Roccanti: One that gets overlooked a lot is covenant headroom. If you have loan covenants, you really want to make sure you’re meeting them. If you don’t know where you stand and the covenants start squeezing, you’re going to be out of compliance. That is going to be a huge issue with your lender. They could even call the loan on you.
[16:47] Kyle Paxton: This is all about managing risk. When real estate deals go well, you get all the upside. But not every deal goes that way. This is really about distilling this information down in a way that you can appropriately manage your properties and get out in front of any risk across all of these areas.
[17:18] Kyle Paxton: I want to emphasize the importance of something I see all the time in business. We budget and then we don’t stick to the budget. We go through the exercise of doing a budget but don’t maximize the potential there. And that comes down to real-time data. We talk a lot about lending stress and going through the lending process and making sure your financial records are sound. It’s all about managing risk and making sure we’re well optimized to fill gaps in our operations and overall performance.
[18:03] Daniel Roccanti: KPIs are the front end. That’s our data. But where I see a lot of mistakes happen isn’t always on the KPI side. It’s on the back end. Configuring is the foundation. This is where a lot of firms accidentally create bad reporting.
[18:27] Daniel Roccanti: One of the things we see is people start building reports with no foundation, no one defining the metrics. You really need to make sure there is one definition for everything. What is occupancy? When I say occupancy, am I saying physical or economic? Completely different. What is my net operating income? What’s actually included or excluded? A lot of times there are things like management fees and non-recurring items. Are they included? Even internal rate of return and equity multiples, they all just need consistency. Before you configure your reports, make sure you’re defining the metrics so it’s consistent across every single report.
[19:30] Kyle Paxton: Another big mistake I see is inconsistency in the attributes. Real inconsistency across how we’re naming things, how properties are classified, how investors are classified and what types of entities they are.
[19:56] Kyle Paxton: There are a lot of areas where if you don’t have a robust system, the data just gets out of control. We’re throwing investors in on the fly, adding properties without consistent naming conventions. All of a sudden you’re tracking NOI four different ways across properties you may not even be able to identify correctly. It creates more problems than it solves. So it’s intentionality on the front end. Building reports and dashboards is trial and error, and we tweak ours all the time, but before you get started you need a good system in place.
[20:46] Daniel Roccanti: A recurring theme here is consistency. Across all your properties, what happens a lot of times is every property is a little different and then when you consolidate it, it makes your data confusing. What we want to see is consistency at the property level, at the entity level, at the investor level, so that when everything comes together at the fund level it makes sense.
[21:34] Daniel Roccanti: Where inconsistency can happen is the chart of accounts. If every single entity doesn’t have the same chart of accounts, problems start. One entity is recording contract services in repairs and maintenance, another is recording it in administrative expenses, another in payroll. When you consolidate it, you have all these variances because they’re inconsistent.
[21:56] Daniel Roccanti: Your property-level structure needs to be the same across every entity so that when it rolls up, you’re getting actual data. What is truly the fund-to-entity relationship? And attributes across all the markets need to be consistent. Asset class, strategy, plan. So when you consolidate at the portfolio level you can truly compare apples to apples.
[23:13] Kyle Paxton: Having that consistency minimizes mistakes both operationally and on the compliance side. A lot of times real estate is held in LLCs with several parcels of real estate within a single LLC. For tax return purposes, I have to roll all of those things up into one clean tax return. If everything is clean and consistent, same chart of accounts, they roll together the same way. We make the same three journal entries every year and keep it moving. That saves compliance costs.
[24:00] Kyle Paxton: On the operational side, when you look at something, you don’t have to spend 15 minutes trying to figure out how the chart of accounts works. Is this a revenue account? Is this a liability account? How does it tie into my KPIs? I know my standard set and I can see it repeated over and over again. That just helps minimize mistakes. Having that consistency in a controlled software environment outside of Microsoft Excel, where you can just do whatever you want, helps optimize your business and reduce mistakes both operationally and through compliance. And there are real dollars attached to that.
[25:01] Daniel Roccanti: A few other mistakes we see: try to limit Excel. We love Excel, and it’s great for analysis, but it can be risky when you’re using it for reporting. If something happens and a number needs to change, it might change in Excel but it doesn’t change in your accounting software or your other reports. It’s better to use something like Power BI or anything that connects directly to your Yardi data, which is more like a business intelligence tool where a change in one place actually flows through.
[25:59] Daniel Roccanti: Also make sure you’re aware of over-customization without governance. If you start creating all these custom reports, you can end up with too many. You’ve created a bunch of one-off reports that are very similar. No one really owns them. Make sure when you’re doing customization there’s always an owner for every single report, and there should be consistency throughout so you don’t have 100 different occupancy reports where they all have one thing slightly different with them.
[26:50] Daniel Roccanti: Make sure that whether it’s property managers, asset managers or investor relations, everyone is using the same reports. Or if they are different, someone understands why and you’re able to control it.
[27:14] Kyle Paxton: Now I want to jump into integrating Yardi and the accounting function and drive home what it looks like at a connected system level, talking about user roles, security and who has access to what. Starting at the foundation, if we’re looking at this through the lens of a fund manager, accounting data has to support more than just your regular monthly financial statements. It’s the consolidations of the properties, the overhead expenses eliminated between properties. Investors want to know distributions and have real data around what those distributions mean for their capital accounts and future returns. There’s also lender reporting and audit scenarios.
[28:18] Kyle Paxton: One of the really nice things about a platform like Yardi is it creates an environment where you can have several different stakeholders within and outside of your business who can get the information they want quickly and in a manner that makes sense to them.
[28:40] Kyle Paxton: Looking at this from a cross-functional storytelling perspective, when you want to tell a story about your business with real-time data, asset managers are typically focused on operating trends. Controllers want to reconcile numbers and see those inputs into the static financial statements. Investors and the investor relations team want clean investor-facing outputs that support the distributions and tax allocations they’re seeing on their K-1s.
[29:12] Kyle Paxton: At the high level, the actual fund manager and executive just want the macro view, the exceptions and risk indicators they need to be paying attention to. That is very much getting out in front of risk. In an environment like this, it takes your accounting function to a whole other level because those are four very different things you’re able to achieve in real time within the same platform.
[29:41] Kyle Paxton: Yardi connects with Power BI and other third-party data sources. There are many different ways you can slice this, and if you have other inputs outside of this core software environment you can aggregate the data together from different platforms and still get good real-time information. There’s a lot of flexibility there, which is great, but it also creates risk of making things too complicated.
[30:07] Kyle Paxton: The last point I really want to drive home is putting together that data flow roadmap and understanding what the inputs are to create good accounting records and good operational tracking methods, so we can distill this information in a way that makes sense for our team.
[30:38] Daniel Roccanti: Great point, Kyle. The last thing we want to cover is investor reporting. Investor reporting is very important and it should always be timely, repeatable and controlled. Yardi has Yardi Investment Manager, which is basically an investor portal and a CRM all in one. This is really the way to automate your investor reporting, which reduces your manual compliance, improves transparency and improves consistency.
[30:58] Daniel Roccanti: If you really want to take that next step in investor reporting, there’s a lot of automation available here. The portal provides your investors with access to all these metrics and reports, and now you’re automating your quarterly statements and all these KPIs so your investors can review them. It’s a really easy way to provide transparency to your clients and add value through automation.
[31:50] Kyle Paxton: Investor reporting needs to be clear. I see underperforming funds lose the trust of their investors. While part of that is disappointment in fund performance, those conversations normally come back to the communication from the fund not being clear and transparent. So the system has to be timely, repeatable, controlled and crystal clear.
[32:15] Kyle Paxton: What we like to see, and what a software package can really help you get your hands around, is moving beyond just sending a quarterly investor statement. It’s here’s how the portfolio is performing now, what it did last quarter, here’s what we’re watching this quarter, and here’s how that impacts the investment thesis we put in front of you on day one that got you to sign on the dotted line.
[32:46] Kyle Paxton: Connecting recent performance to what you’re watching going forward and how it ties back to what investors agreed to is really what I see moving the dial most in retaining and growing the trust of your investors, especially if performance of certain properties or the fund is lower than anticipated.
[33:09] Daniel Roccanti: Hope this video helped you understand a little bit more about Yardi and your property management software so you can start getting the most out of it. Stay tuned for next time when we give you more helpful tips in the real estate industry. Thank you.
If your reporting setup is not giving you the real-time visibility your business needs, James Moore can help. Contact a James Moore professional to talk through your Yardi configuration, KPI framework or investor reporting process.
All content provided in this article is for informational purposes only. Matters discussed in this article are subject to change. For up-to-date information on this subject please contact a James Moore professional. James Moore will not be held responsible for any claim, loss, damage or inconvenience caused as a result of any information within these pages or any information accessed through this site.